Hydrogen TechnologyHydrogen as a form of Renewable Energy
Dilatometerby Linseis Thermal Analysis
A good example where thermal analysis comes into play at renewable energy is the thermal expansion behavior of light-construction-materials like composites for wind mill blades:
Composite materials are used in light constructions or as special construction materials for many purposes.
For instance, the blades of windmills are made of light aluminum alloys or light polymers.
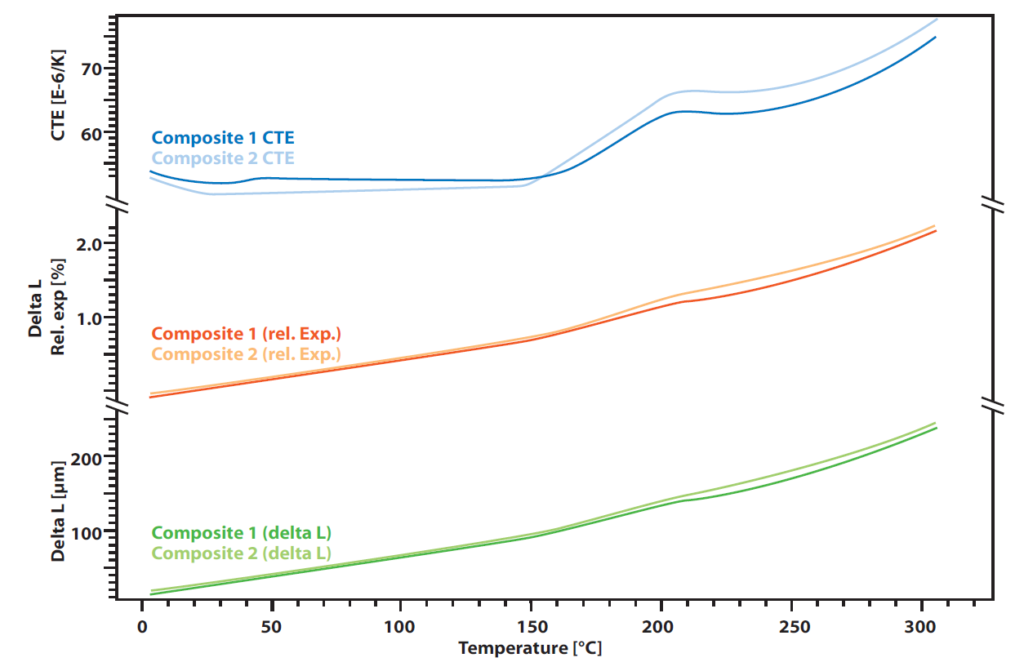
The measurement shows the slight difference in two polymer composites that are used for stiff but light constructions like windmill blades. The absolute delta L that was measured by a Linseis pushrod dilatometer by constant heating with linear rate of 5 K/min (lower curve). It does not show a significant difference between the two samples that were analyzed. Also, the relative expansion (red curves) is very similar.
However, there is a slight difference that becomes visible when the CTE is observed. Before the transformation point at around 200°C, there is a little effect that can be seen only at one of the two samples, indicating another small transformation or phase change that the other material does not show.
High Pressure TGA – Thermo balanceby Linseis Thermal Analysis
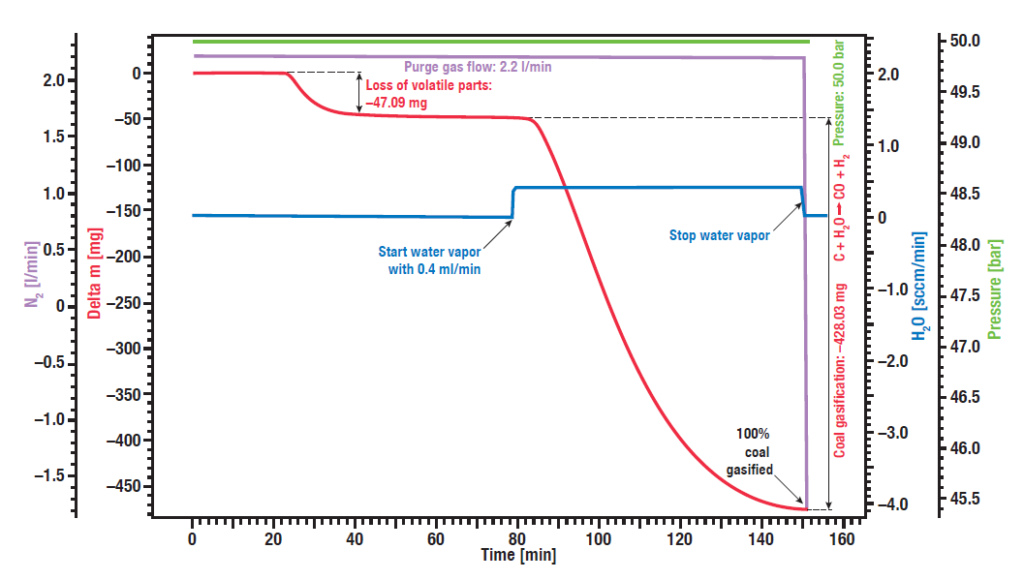
Another important point for the production of hydrogen is the quality and behavior of the raw materials, e.g. the used biomass for power and hydrogen generation. A typical application for high pressure TGA measurements is the investigation of the so-called coal gasification or hydro-gasification. This process, where carbon is heated in a water steam atmosphere, is used in catalytical processes, for example to remove carbon monoxide from exhaust fumes and specially to get valuable organic compounds out from resources like charcoal or biomass. The given example shows a typical gasification experiment of dry biomass. The biomass sample was heated to an isothermal plateau under nitrogen atmosphere at 50 bar pressure (High Pressure TGA – Thermo balance).
The mass signal shows the loss of volatile components between 20 and 40 min. After water vapor was added, the biomass was gasified and nearly completely consumed after 150 min, leading to H2, CO, CH3OH and other useful reactive gases, as shown by the red mass loss curve.
STA PT-1600Investigation of burning behavior and ash content of composite materials.
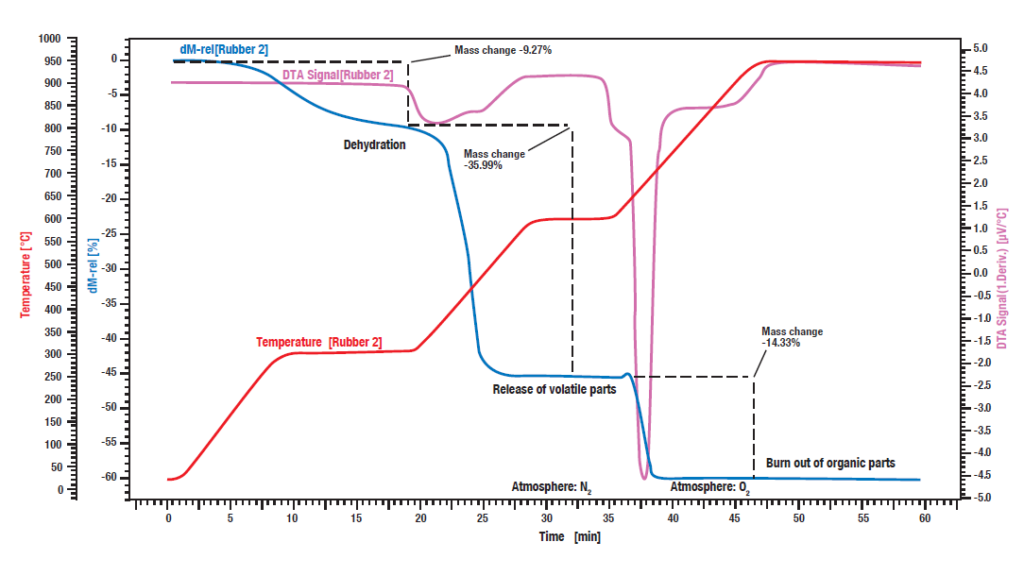
After the product life cycle time ends, the composite materials need to be recycled or energetically used. For this, it can be of interest to investigate the burning behavior and ash content. Carbon containing materials, organics and polymers usually burn off when heated. In most cases it is carried out in inert atmospheres instead of air to be able to see decomposition effects and pyrolysis, followed by a gas switch to oxygen or air, leading to a burn off of the contained carbon. If this procedure is carried out on a combined thermal analyzer (STA).
This measurement of an industrial rubber sample was carried out with a simultaneous thermal analyzer STA PT 1600, starting at nitrogen atmosphere. The sample was heated in three steps with each 30 K/min. The blue curve shows the relative weight loss where the dehydration of the sample takes place. The amount of water was 9.3 %. The corresponding DTA signal (purple curve) did not show any effect during the evaporation of water.
In the second reaction step, the volatile components are released by pyrolysis under N2 atmosphere. The amount of these components is 36.0%. Their release can be identified by an exothermic reaction peak on the DTA curve.
For the third reaction step, the atmosphere is changed to O2, leading to a burn off of the remaining carbon. The loss in weight is 14.3 %. The remaining 40.4 % are inorganic components like ashes, slake or fillers.